
Price per Square Meter: 2026 Guide and 43-City Benchmarks
Learn how to calculate price per square meter and compare apartment costs across 43 European cities. A 60 m² home at the city average ranges from €90,000 in Chisinau to €2,880,000 in Monaco.
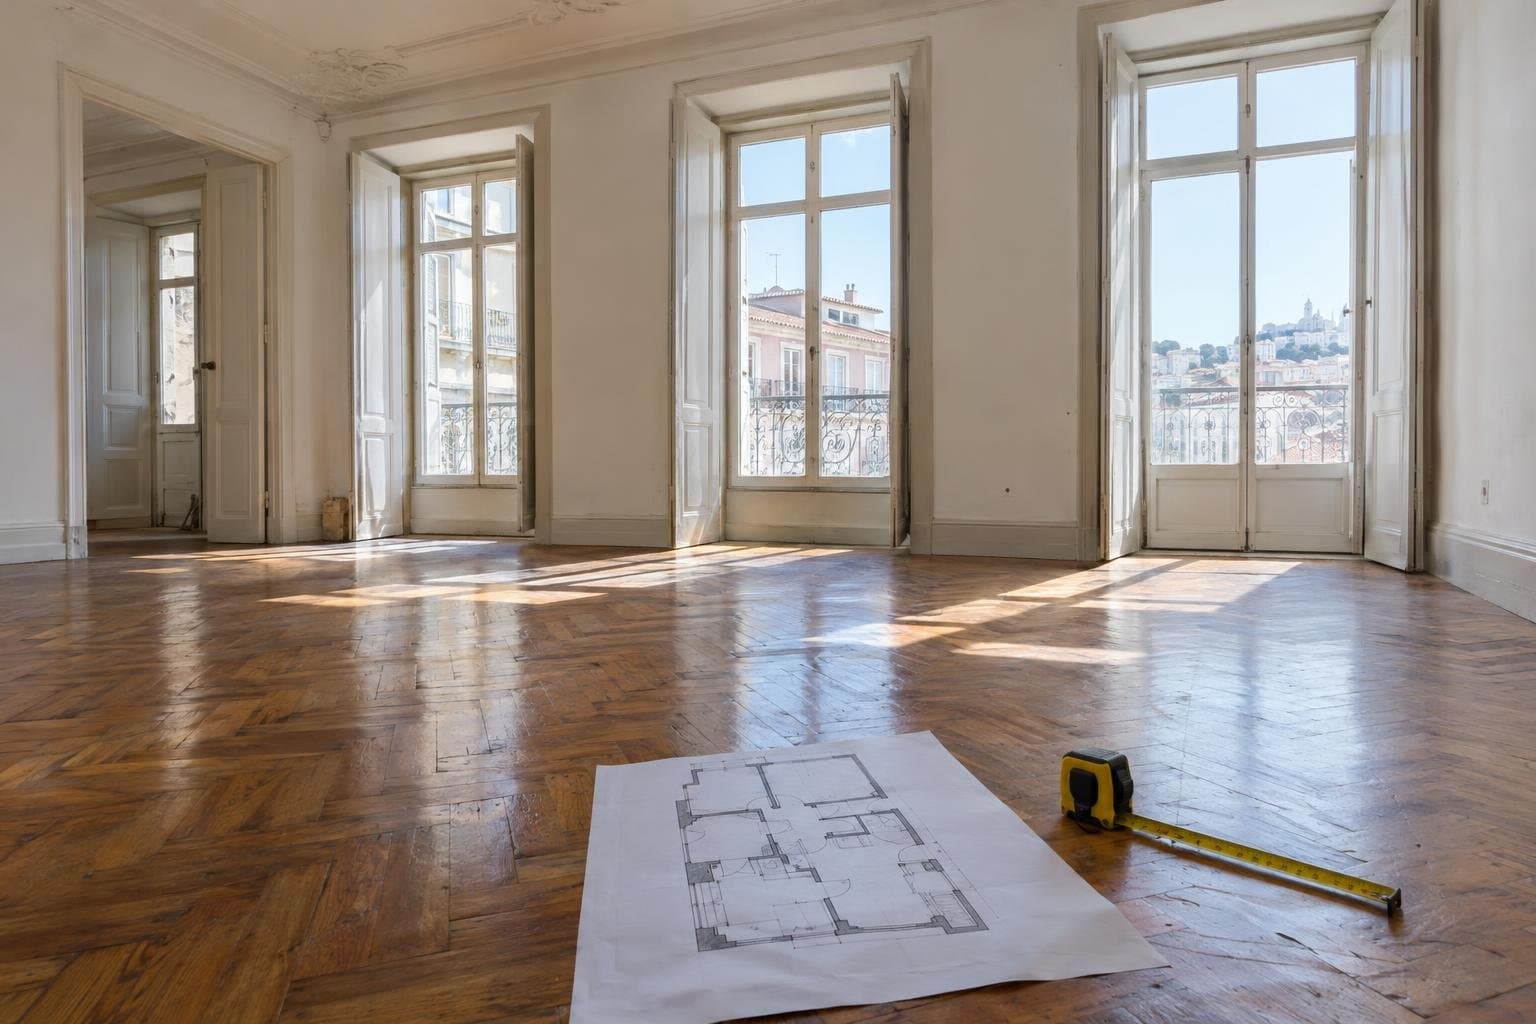
Price per square meter is a simple way to compare the cost of homes with different floor areas, but it is only a useful starting point if the location and property are comparable. We analyzed SQMData’s Q1 2026 benchmarks for 43 European cities to explain the calculation, show what a 60 m² apartment costs at selected city averages, and rank the premium for city-center properties.
Key findings
- Across 43 tracked city averages, the median price is €4,700 per m². The lower and upper quartiles are €2,800 and €6,800 per m².
- The lowest city average is Chisinau at €1,500 per m²; the highest is Monaco at €48,000 per m².
- The city-center premium ranges from 14.6% in Monaco to 65.2% in London. It is higher than the citywide benchmark in all 43 tracked cities.
- At each city’s average rate, a 60 m² illustration costs €90,000 in Chisinau, €252,000 in Lisbon, €672,000 in London, and €2,880,000 in Monaco.
- Price per m² helps screen a listing against a city benchmark, but it does not account for a home’s exact location, condition, floor level, or area measurement basis.
What price per square meter means
Price per square meter (also written as price per m²) is the property price divided by its floor area in square meters. It expresses the price of each square meter, making it easier to compare properties that are not the same size. The corresponding price per square foot uses square feet as the area unit; do not mix the two units when comparing figures.
For example, a smaller apartment can have a higher total price per m² than a larger apartment even if the larger apartment costs more overall. The unit rate separates the size of the home from its total price. In this article, the citywide and city-center figures are the average benchmarks published for each tracked city, not a quote for a particular apartment.
How to calculate price per square meter
The formula is:
Price per m² = total property price ÷ floor area in m²
A price per square meter calculator applies this division. You need the property’s total price and its floor area, expressed in square meters. For instance, if a home costs €300,000 and has 60 m² of floor area, the calculation would be €300,000 ÷ 60 = €5,000 per m². The result is a unit-price comparison, not an estimate of taxes, fees, or other buying costs.
The same calculation can be reversed to make an illustrative budget from a published city average. At the Q1 2026 benchmarks:
- In Chisinau, €90,000 ÷ 60 m² = €1,500 per m².
- In Krakow, €186,000 ÷ 60 m² = €3,100 per m².
- In Lisbon, €252,000 ÷ 60 m² = €4,200 per m².
- In London, €672,000 ÷ 60 m² = €11,200 per m².
These are calculations from the city-average rates, not prices for specific 60 m² listings. They demonstrate how to calculate price per square meter and illustrate the wide differences between city benchmarks. The calculation for a real listing is the same: divide its price by its own stated floor area, then compare the result with an appropriate benchmark.
2026 price per square meter benchmarks
The 43 city averages have a median of €4,700 per m². To show the distribution, we sorted the city figures and took the median of the lower 21 values for the lower quartile (€2,800), and the median of the upper 21 values for the upper quartile (€6,800). The median of all 43 values is €4,700. This describes the spread of tracked city averages; it is not a European-wide national average or a price range for individual homes.
The city-center comparison uses the same published city and center rates for every city. The table is ordered by the calculated center premium, from highest to lowest. The first two price columns let buyers see both the underlying benchmark and the center rate, rather than relying on the premium alone.
| Rank | City | City average (€/m²) | Center average (€/m²) | Center premium |
|---|---|---|---|---|
| 1 | London | €11,200 | €18,500 | 65.2% |
| 2 | Limassol | €4,700 | €7,200 | 53.2% |
| 3 | Athens | €2,800 | €4,100 | 46.4% |
| 4 | Lisbon | €4,200 | €6,100 | 45.2% |
| 5 | Rome | €5,200 | €7,500 | 44.2% |
| 6 | Belgrade | €2,400 | €3,400 | 41.7% |
| 7 | Milan | €6,500 | €9,200 | 41.5% |
| 8 | Porto | €3,400 | €4,800 | 41.2% |
| 9 | Budapest | €3,200 | €4,500 | 40.6% |
| 10 | Munich | €8,200 | €11,500 | 40.2% |
| 11 | Chisinau | €1,500 | €2,100 | 40.0% |
| 12 | Valencia | €2,800 | €3,900 | 39.3% |
| 13 | Sofia | €1,800 | €2,500 | 38.9% |
| 14 | Amsterdam | €8,500 | €11,800 | 38.8% |
| 15 | Madrid | €4,900 | €6,800 | 38.8% |
| 16 | Bucharest | €2,100 | €2,900 | 38.1% |
| 17 | Malaga | €3,200 | €4,400 | 37.5% |
| 18 | Warsaw | €3,500 | €4,800 | 37.1% |
| 19 | Thessaloniki | €2,200 | €3,000 | 36.4% |
| 20 | Krakow | €3,100 | €4,200 | 35.5% |
| 21 | Prague | €4,800 | €6,500 | 35.4% |
| 22 | Oslo | €8,900 | €12,000 | 34.8% |
| 23 | Stockholm | €7,800 | €10,500 | 34.6% |
| 24 | Tallinn | €2,600 | €3,500 | 34.6% |
| 25 | Dublin | €5,800 | €7,800 | 34.5% |
| 26 | Lyon | €5,100 | €6,800 | 33.3% |
| 27 | Vilnius | €2,700 | €3,600 | 33.3% |
| 28 | Vienna | €6,800 | €9,000 | 32.4% |
| 29 | Helsinki | €6,200 | €8,200 | 32.3% |
| 30 | Riga | €2,500 | €3,300 | 32.0% |
| 31 | Copenhagen | €7,200 | €9,500 | 31.9% |
| 32 | Hamburg | €6,100 | €8,000 | 31.1% |
| 33 | Zagreb | €2,900 | €3,800 | 31.0% |
| 34 | Barcelona | €5,500 | €7,200 | 30.9% |
| 35 | Larnaca | €2,600 | €3,400 | 30.8% |
| 36 | Bratislava | €3,600 | €4,700 | 30.6% |
| 37 | Zurich | €15,800 | €20,500 | 29.7% |
| 38 | Ljubljana | €3,800 | €4,900 | 28.9% |
| 39 | Brussels | €4,500 | €5,800 | 28.9% |
| 40 | Berlin | €5,900 | €7,600 | 28.8% |
| 41 | Geneva | €14,200 | €18,000 | 26.8% |
| 42 | Paris | €12,500 | €15,800 | 26.4% |
| 43 | Monaco | €48,000 | €55,000 | 14.6% |
Source: SQMData city benchmarks, prices as of Q1 2026. Center premium = (centerPricePerSqm ÷ pricePerSqm − 1) × 100; cities are sorted by the unrounded result. Displayed percentages are rounded to one decimal place.
Using the benchmark to assess a listing
First calculate the listing’s own price per m², then compare it with the citywide figure and, where relevant, the city-center figure. For example, the Lisbon benchmarks are €4,200 per m² citywide and €6,100 per m² in the center. The center premium is (6,100 ÷ 4,200 − 1) × 100 = 45.2%. That difference shows why a listing’s location within the city matters: comparing a central property only with a citywide average can make it look unusually expensive even when the center benchmark is a more relevant reference.
A higher or lower result is a screening signal, not proof that a home is fairly priced. Two apartments in the same city can differ in neighborhood, street, building, condition, and floor level. The city benchmark also compresses those differences into one figure. A buyer should compare similar locations and property characteristics, confirm how the listed floor area is measured, and use the unit rate alongside the total price and property details.
We publish city and country market-data pages and an explore page for further comparisons. The affordability tool can help put a property price in the context of salary data. A per-square-meter calculation answers a narrower question: how much the price represents for each stated square meter. For an additional buying decision, SQMData also provides a rent-versus-buy calculator; its result is separate from a simple €/m² comparison.
Frequently asked questions
How do you calculate price per square meter?
Divide the property price by its floor area in square meters. For a 60 m² apartment at the Chisinau city average, €90,000 ÷ 60 = €1,500 per m².
What is the median price per square meter in these 43 European cities?
The median city average is €4,700 per m² in the Q1 2026 dataset. The lower and upper quartiles are €2,800 and €6,800 per m², respectively.
Which city has the highest price per square meter in the dataset?
Monaco has the highest city average at €48,000 per m², compared with €1,500 per m² in Chisinau, the lowest. These are tracked city benchmarks, not national averages or individual property valuations.
Which city has the largest city-center premium?
London ranks highest at 65.2%: its center benchmark is €18,500 per m², versus €11,200 per m² citywide. Monaco has the smallest premium, 14.6%, despite having the highest absolute city and center prices in the table.
Methodology. We used SQMData’s city benchmarks, with prices as of Q1 2026, covering pricePerSqm and centerPricePerSqm for 43 tracked cities. Price per m² is calculated as price divided by floor area; the four 60 m² examples multiply each city’s average rate by 60 and then show the reverse division. Quartiles use the medians of the lower and upper halves of the sorted 43-city list, excluding the overall median from those halves. City-center premium is (centerPricePerSqm ÷ pricePerSqm − 1) × 100; displayed percentages are rounded to one decimal place. The benchmarks are city-level figures, not national averages, and do not adjust for property-specific features or differences in area measurement. This article is general information, not financial, tax, or legal advice.